What really happened on October 10 Crypto Crash?
Little Backstory
On October 10, crypto didn’t just dip…
It experienced its largest-ever liquidation cascade ($19B+).
After the crash, Bitpulse conducted simulations to understand why the market had broken so quickly and violently.
The reconstruction revealed three structural weaknesses:
A. High-leverage instability above 10×
B. Size-based liquidation asymmetry (large positions liquidate earlier)
C. Liquidity fragmentation across exchanges
This report reconstructs the October 10 breakdown →
how it started, why it accelerated, and where the system snapped.
A. What We Simulated (And Why It Matters)
Before looking at the real $19B market crash, we tested how leveraged positions behave under stress. We ran stress tests on BTC, ETH, and XRP:
- Two models
- Several leverage levels
- Two position sizes
- A 24h survival challenge
Basically →
“How easily do leveraged positions die in a 24-hour window?”
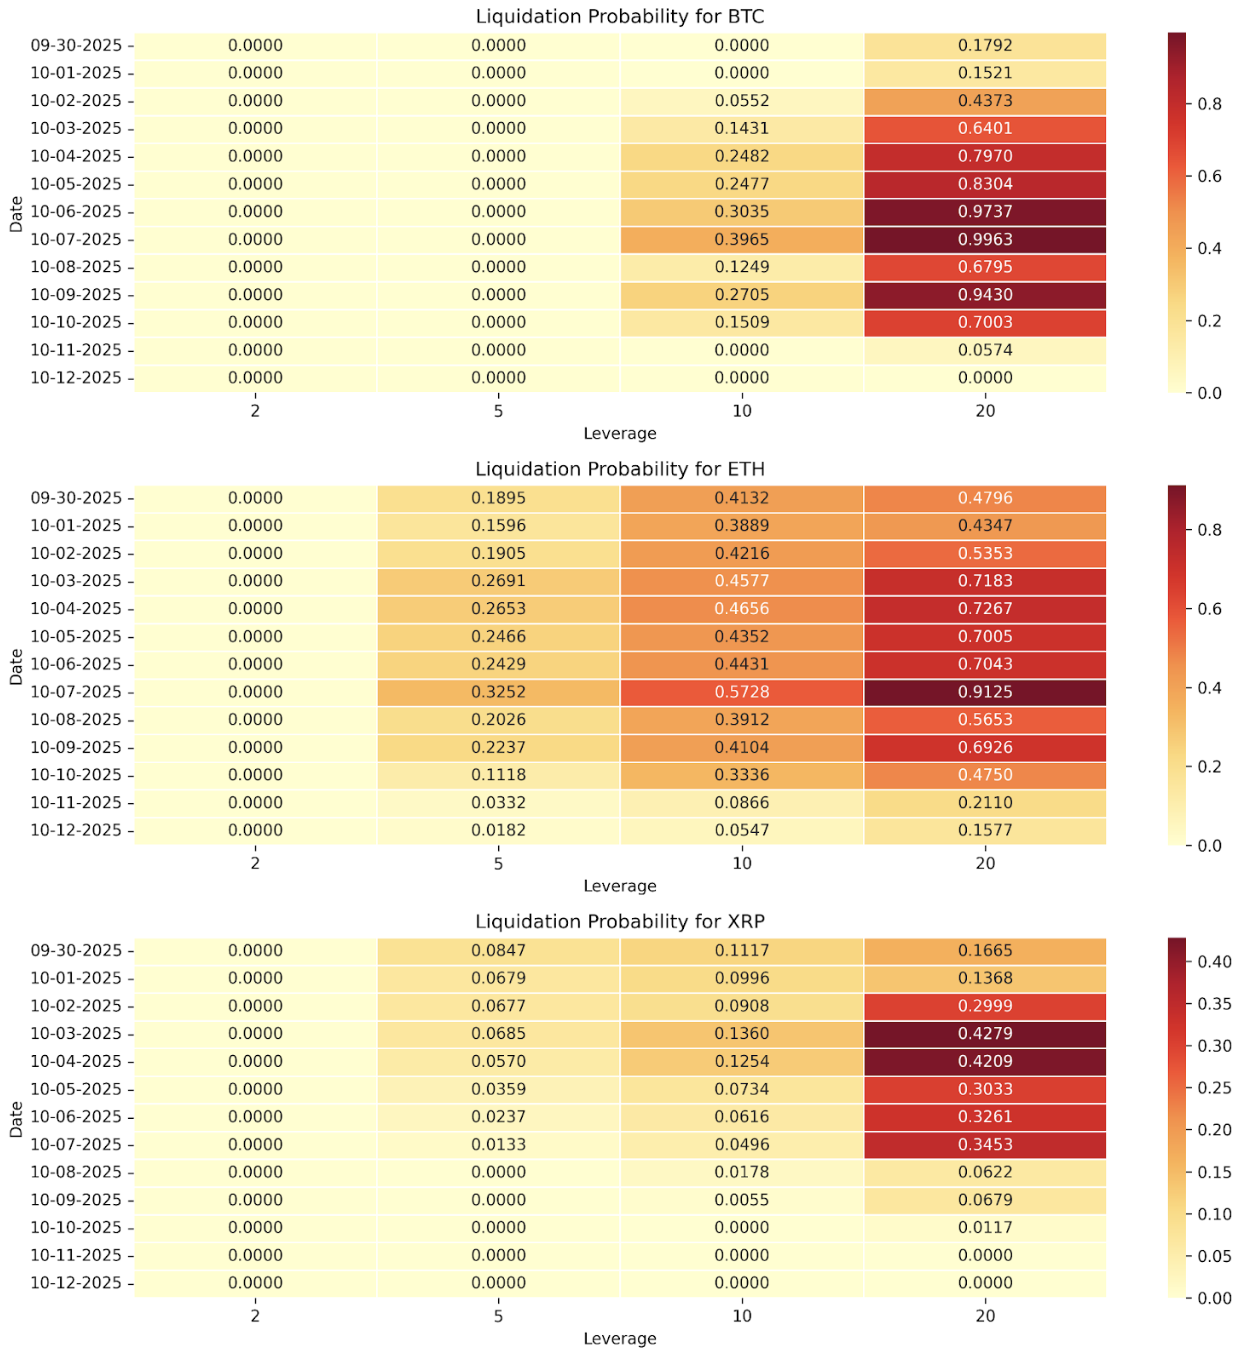
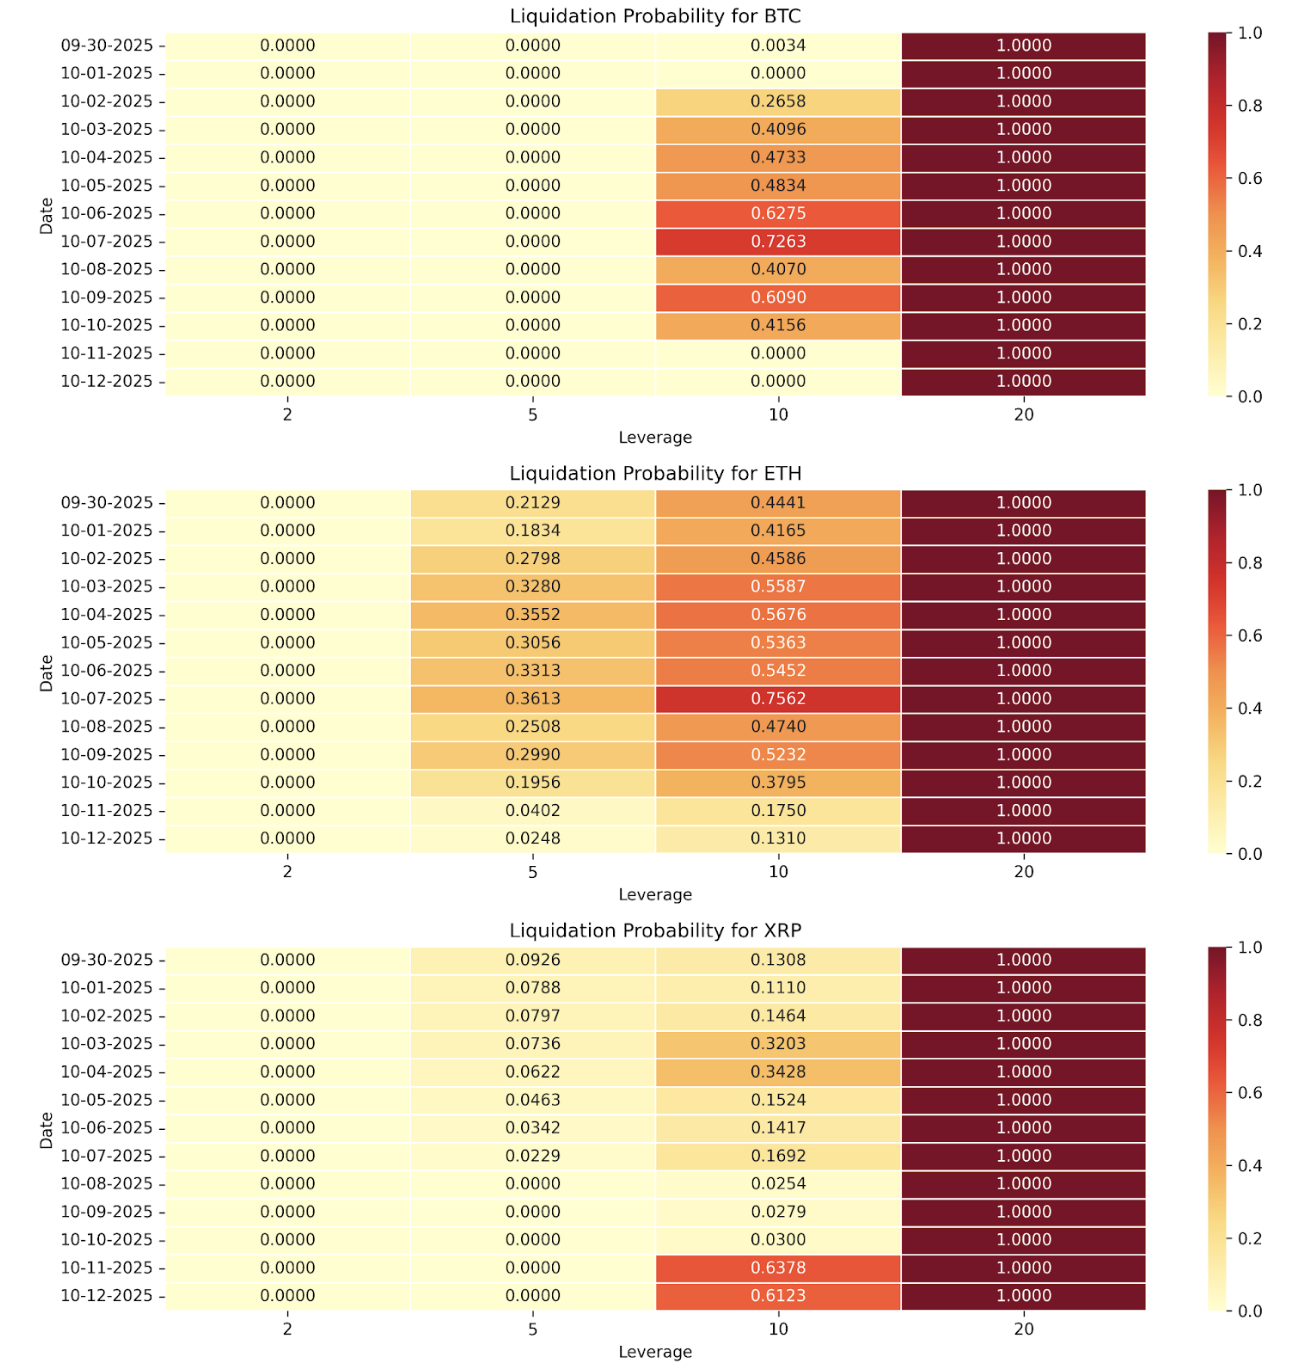
Before you begin, the heatmap below illustrates the liquidation probability of BTC, ETH, and XRP positions across various leverage levels for a series of dates.
- Each row represents a specific date.
- Each column represents a leverage tier (2×, 5×, 10×, 20×).
- Each cell shows the simulated probability that a leveraged position would be liquidated within the 24-hour window for that date and leverage level.
- The scale bar on the right shows the exact color-to-probability mapping. Color intensity indicates the probability:
- Light Yellow → lower probability
- Dark Red → higher probability
And the results...
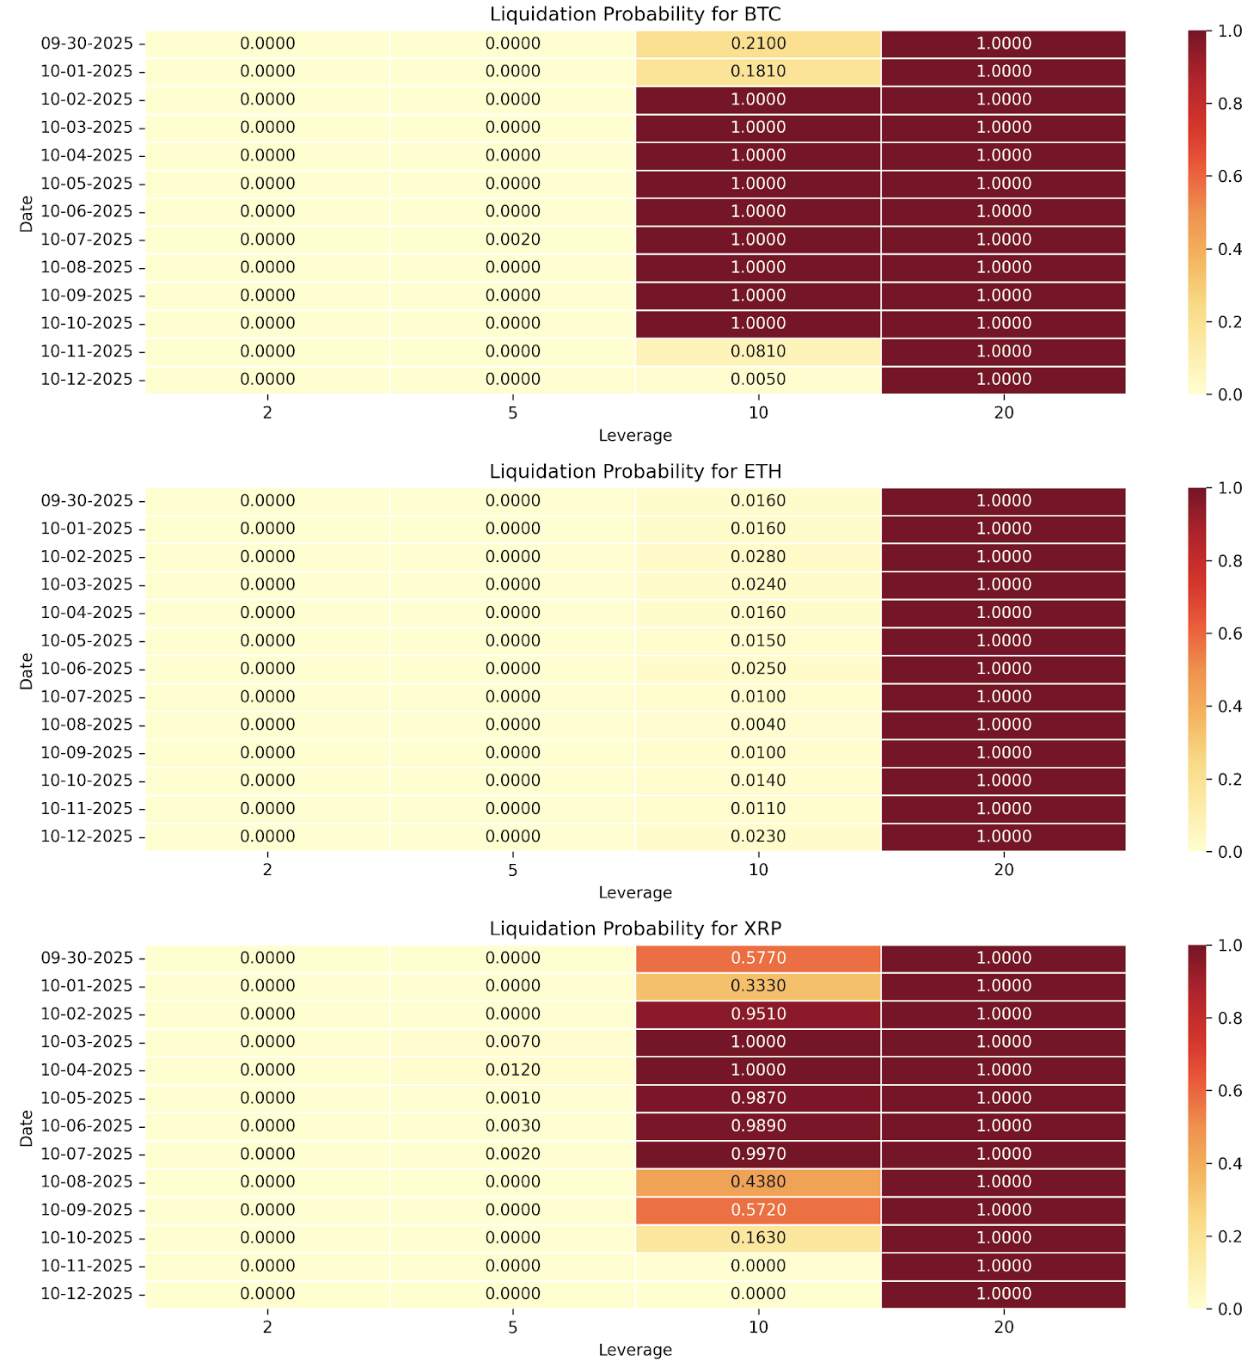
1. GBM Model (Geometric Brownian Motion)
It showed:
- Liquidation risk jumping suddenly from ~10% to 100%
- BTC showing more liquidations than ETH (which opposes the general trend)
- Behaviour varied a lot from $1K to $100K positions.
$1k position simulation
$100k positions simulation
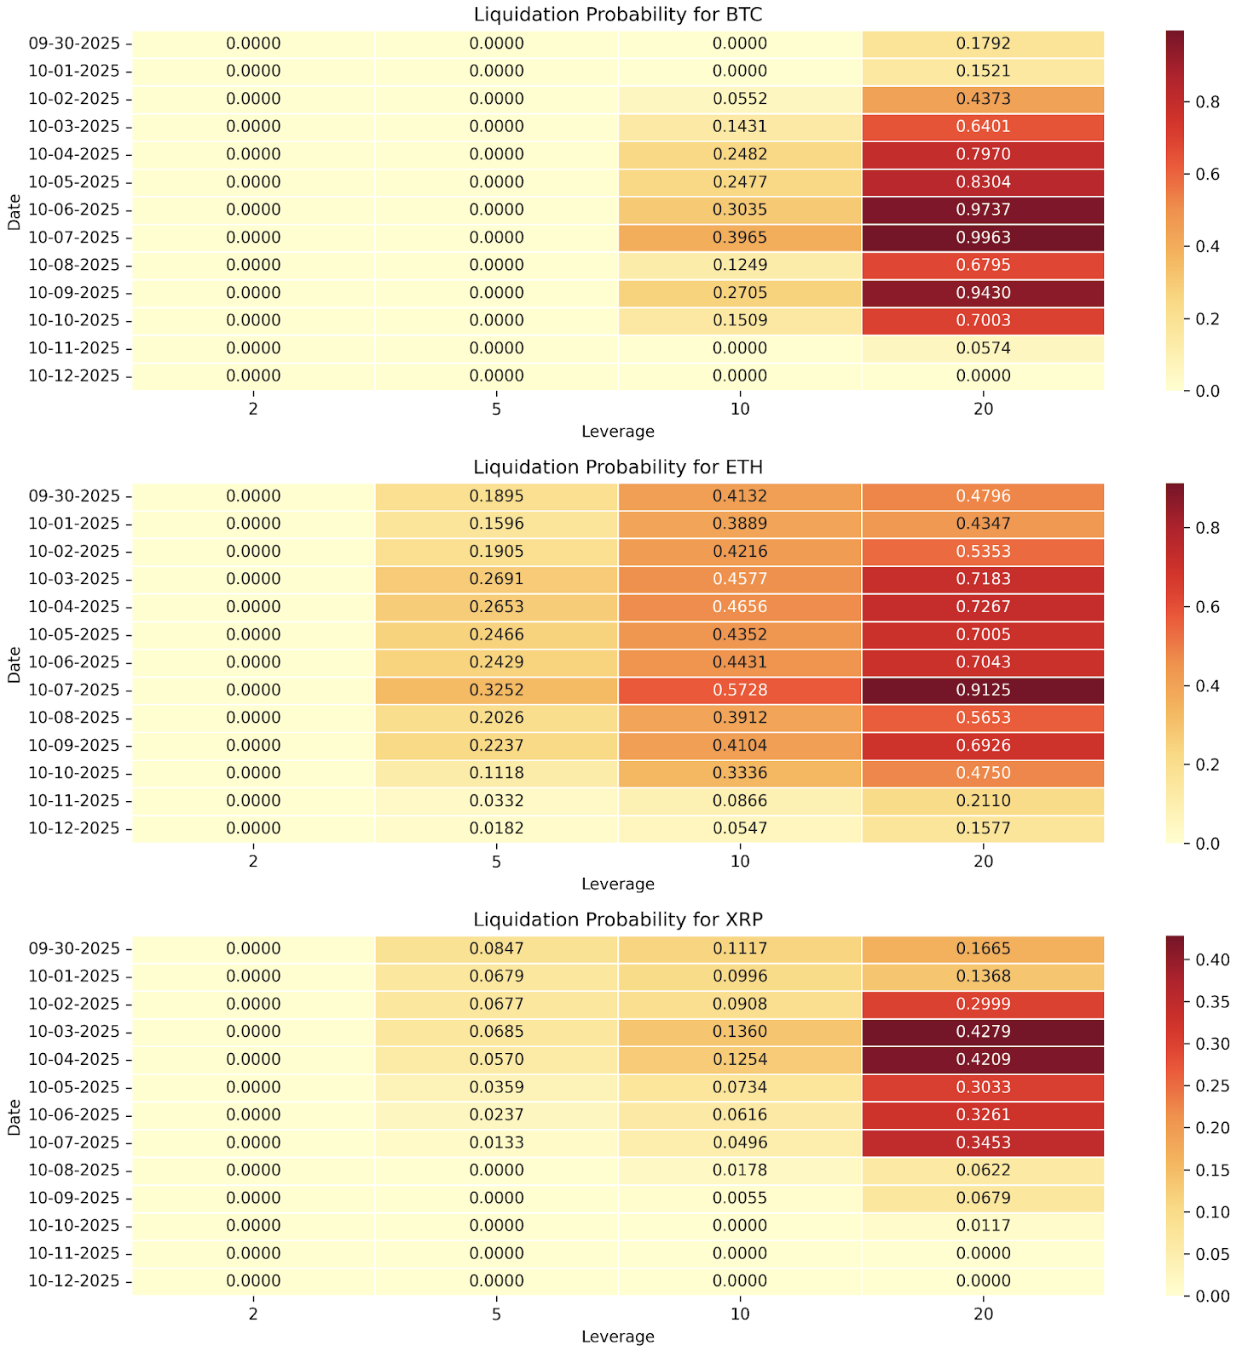
2. Historical Model
- Smoother probability curves
- Logical BTC/ETH behaviour (as expected)
- XRP still showed extra fragility
$1k position simulations
100k position simulations
Our simulations helped explain why that at 10x leverage or higher, liquidation risk jumps dramatically.
On October 10th, that’s exactly what happened… thousands of high-leverage positions were wiped out in minutes.
The GBM model in our simulation showed “binary” behaviour, sudden jumps from low to high liquidation probabilities!
B. The Hidden Rule of Leverage here
Big Positions get liquidated first…
Here’s a plot twist most retail traders don’t know:
A $10K position and a $1M position using 10× leverage do NOT have the same survival odds.
Exchanges don't wait until your losses reach 100% of your margin. They enforce tiered safety margins.
Here’s the simple version:

This means →
- Big traders fall first
- Their liquidations push price lower
- That triggers the next wave
- And the cascade begins
On October 10, that created a domino effect.
Institutions got liquidated first.
And when big money falls, it drags the whole market with it.
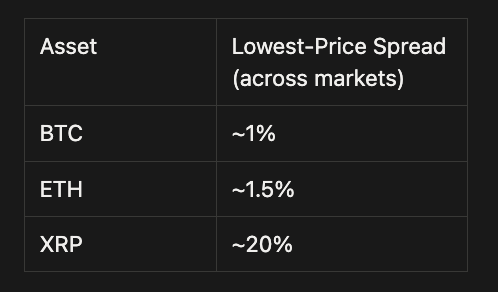
C. LIQUIDITY ANALYSIS
Bitpulse evaluated exchange-level liquidity (using the **Amihud Illiquidity Coefficient)**, comparing intraday lows across Binance, Bybit, Bitget, and MEXC on October 10.
On October 10:
BTC & ETH
- Binance had the deepest lows and best liquidity
- Smaller exchanges (Bitget, MEXC) barely moved, not because they were safer, but because they lacked real trading activity
XRP
- Price dispersion was massive (~20%)
- Illiquid exchanges completely failed to show true market stress
This tells us that →
- Liquid markets have deeper lows, reflecting true price discovery during stress.
- Illiquid markets have prices appear stable but are actually stagnant, with thin trading preventing price discovery.
This suggests that shallow lows on illiquid venues represent a lack of trading depth, not stability.
Final Takeaways →
The October 10 event exposed how fragile and interconnected crypto’s risk landscape is.
Bitpulse simulations and liquidity revealed these vulnerabilities:
- Leverage risk in crypto is nonlinear
- Size matters more than traders realize
- Liquidity fragmentation across exchanges
All these decide violently in real markets.
Some conclusions to remember from this catastrophic event →
- Leverage is a non linear risk in crypto, especially above 10×
- Large positions liquidate earlier than small ones.
- Liquidity decides the “true” bottom.
- Deleveraging events behave like chain reactions.

Get risk insights in your inbox
.webp)